DataDog
Datadog is a powerful monitoring and analytics platform for cloud-scale applications, providing end-to-end visibility across dynamic, high-scale infrastructure. This extension ensures that critical asset issues are promptly addressed by creating tickets for assets not meeting their thresholds and resolving them automatically when the issue is resolved.
Role Required: SDAdmin role in ServiceDesk Plus Cloud and Administrator user in Datadog application.
Benefits
- The extension provides a centralized location to effortlessly track and manage alerts from various assets, streamlining the incident response process.
- Users can automatically create ServiceDesk Plus tickets based on Datadog alerts, saving time and reducing manual efforts required to manage asset thresholds.
- Technicians are immediately notified of asset issues through automated ticketing, ensuring prompt assignment and resolution of critical alerts within the ServiceDesk Plus platform.
- With automatic ticket resolution when assets return to normal thresholds, users avoid manual data entry, reducing the likelihood of errors and freeing up time for more critical tasks.
Set Up dataDog Extension
Configure Extension : Visit the dataDog website and sign in to your account https://app.datadoghq.com/account/login
Note : Each DataDog monitor name must be unique and should not be repeated.
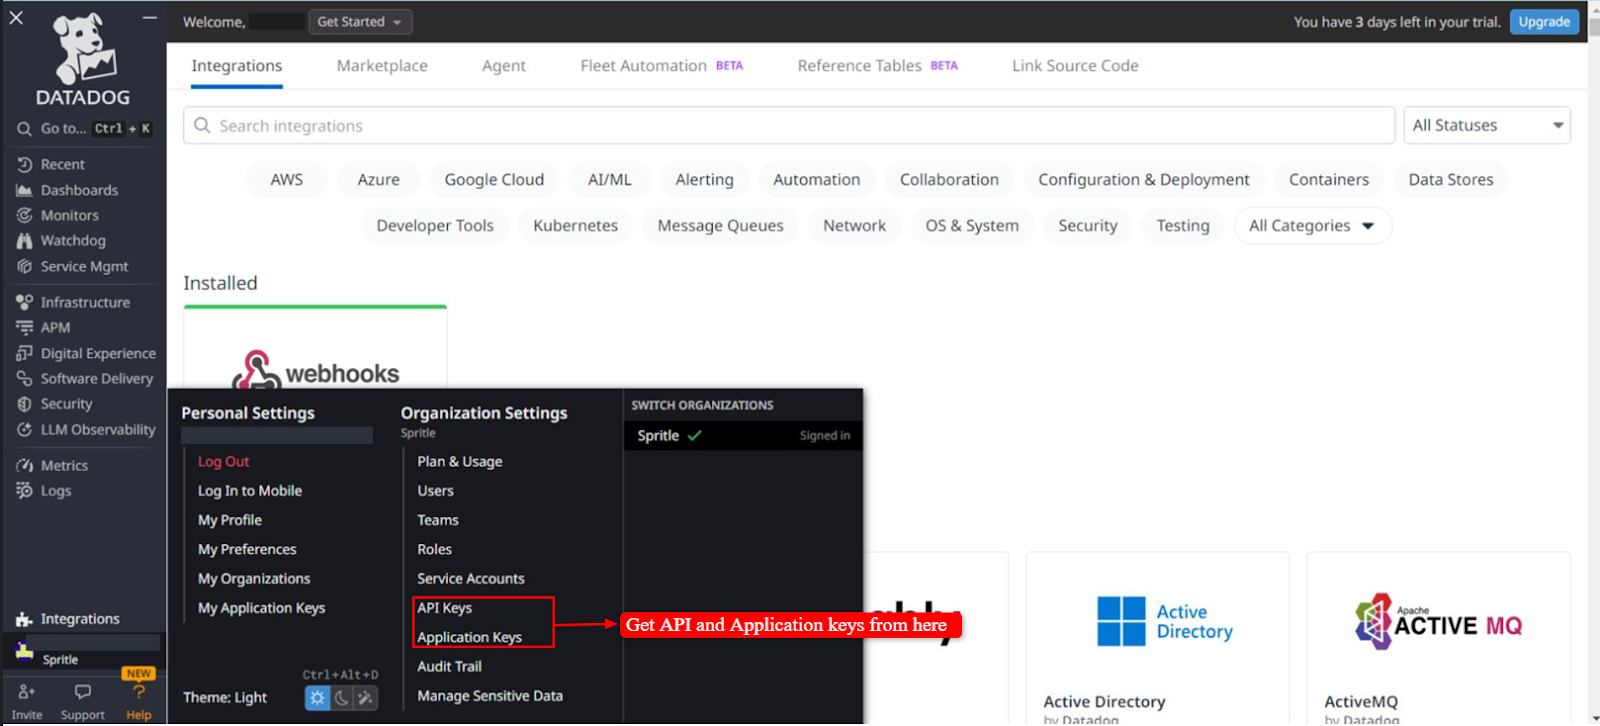
- On the bottom left, navigate to personal settings. In that section, go to Organization Settings > API and Application key.
- Click on the API Key and then copy it.
- Click on the Application key. If the application key is available, copy it, or create one and then copy it.
- Or go to the search and look for API, then find Application Key and then copy it.
- You need to create a monitor in Datadog. If you already have a monitor, it will be displayed in the widget once the connection is made.
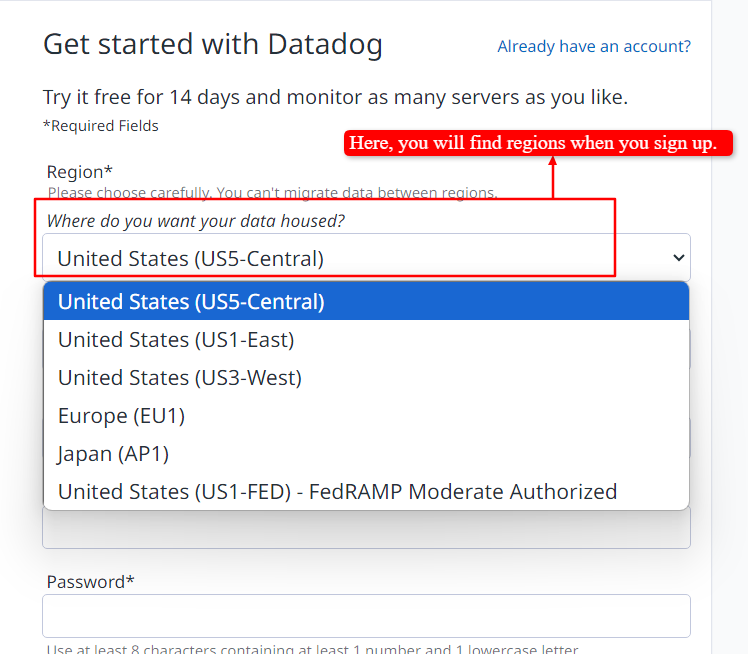
For Regions in DataDog:
If you are a new user of Datadog, click on Try for free to sign up. There, you can find the available regions.
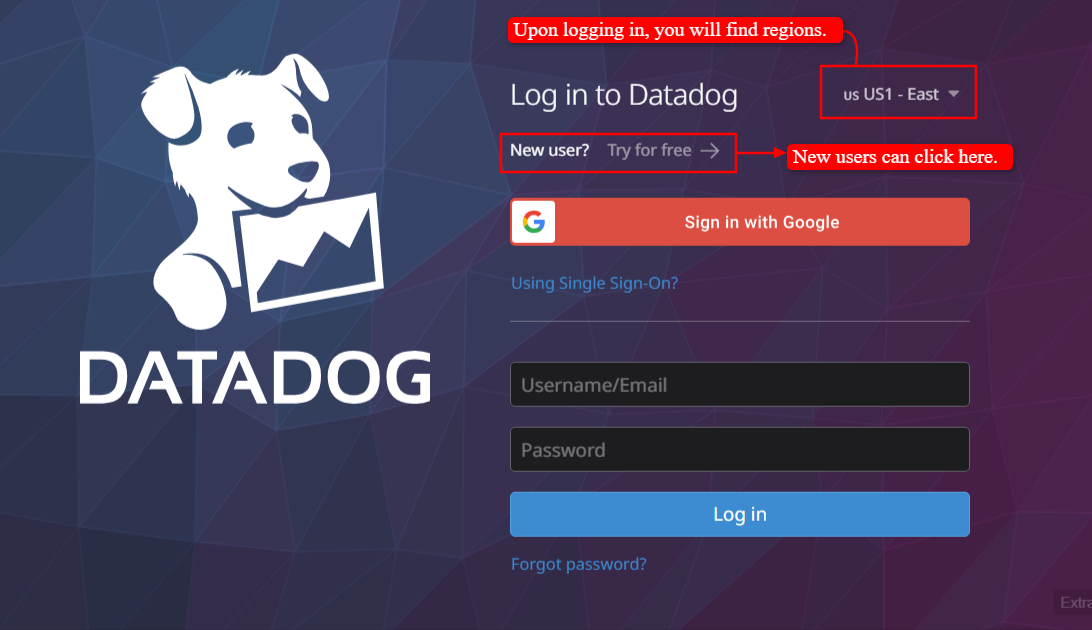
You will find the regions while logging into your account, as we have indicated in the image above.
If you want to locate it in the DataDog application, you can find it in the URL. You just need to select the region based on the URL.

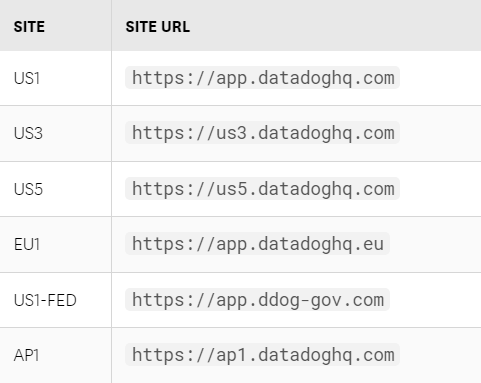
URL’s based on Regions:
In ServiceDesk Plus Cloud, navigate to Setup > Apps & Add-ons > Extensions, and install the DataDog extension. Alternatively, you can also install the extension directly from ManageEngine Marketplace.
- Click Connect, configure your API & Application Keys within the installed extension, and then submit.
- Edit the DataDog regions in the extension variable and input the value of your DataDog region centers like this (e.g., US1, US3, US5, EU1, AP1, US1-FED).
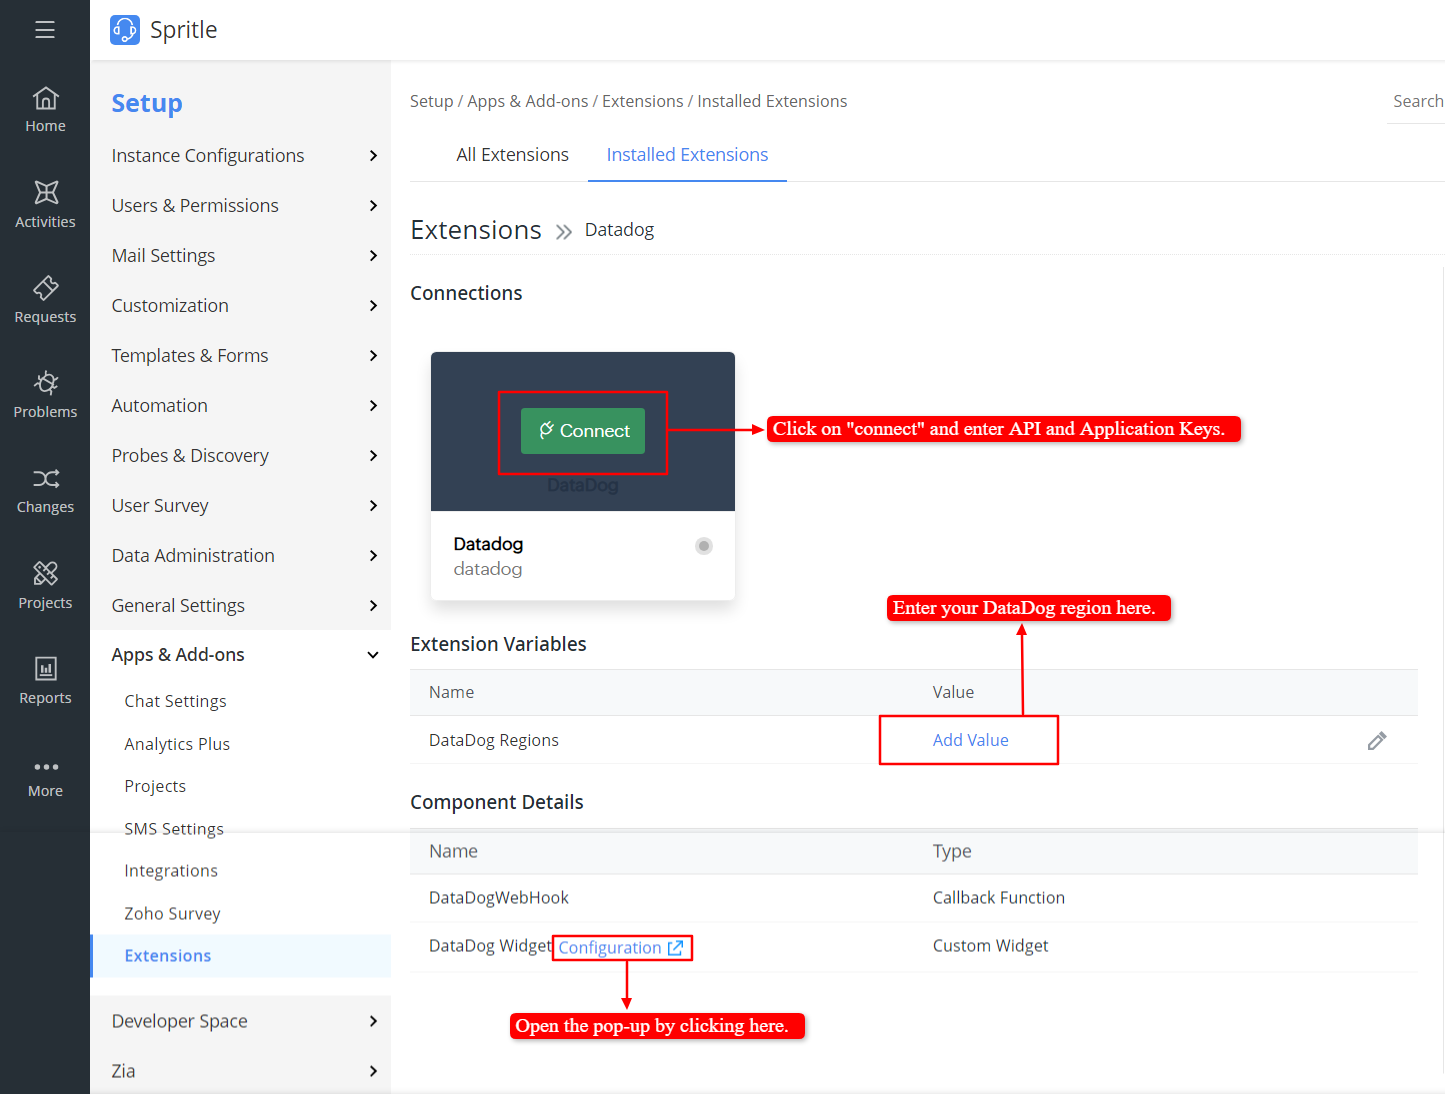
After configuring, click on the configuration. A pop-up will then open. You will be able to see the DataDog monitor list there.
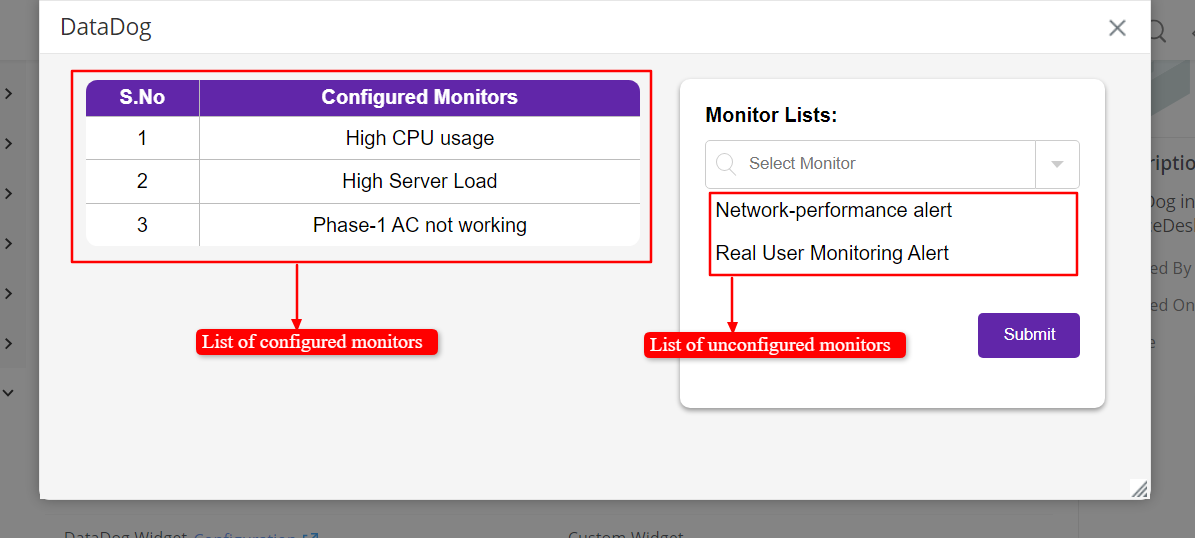
- You can view the list of unconfigured monitors in the form on the right side. Select the monitors from the list you want to configure and then submit the form.
- In the table on the left side, you can view the monitor lists that you have configured using the form.
After you have submitted the form, our webhook will be configured to the Datadog monitors you have selected in the form. When the monitor's threshold reaches a high or low value, it will trigger an alert to ServiceDesk Plus Cloud, which will create a request.
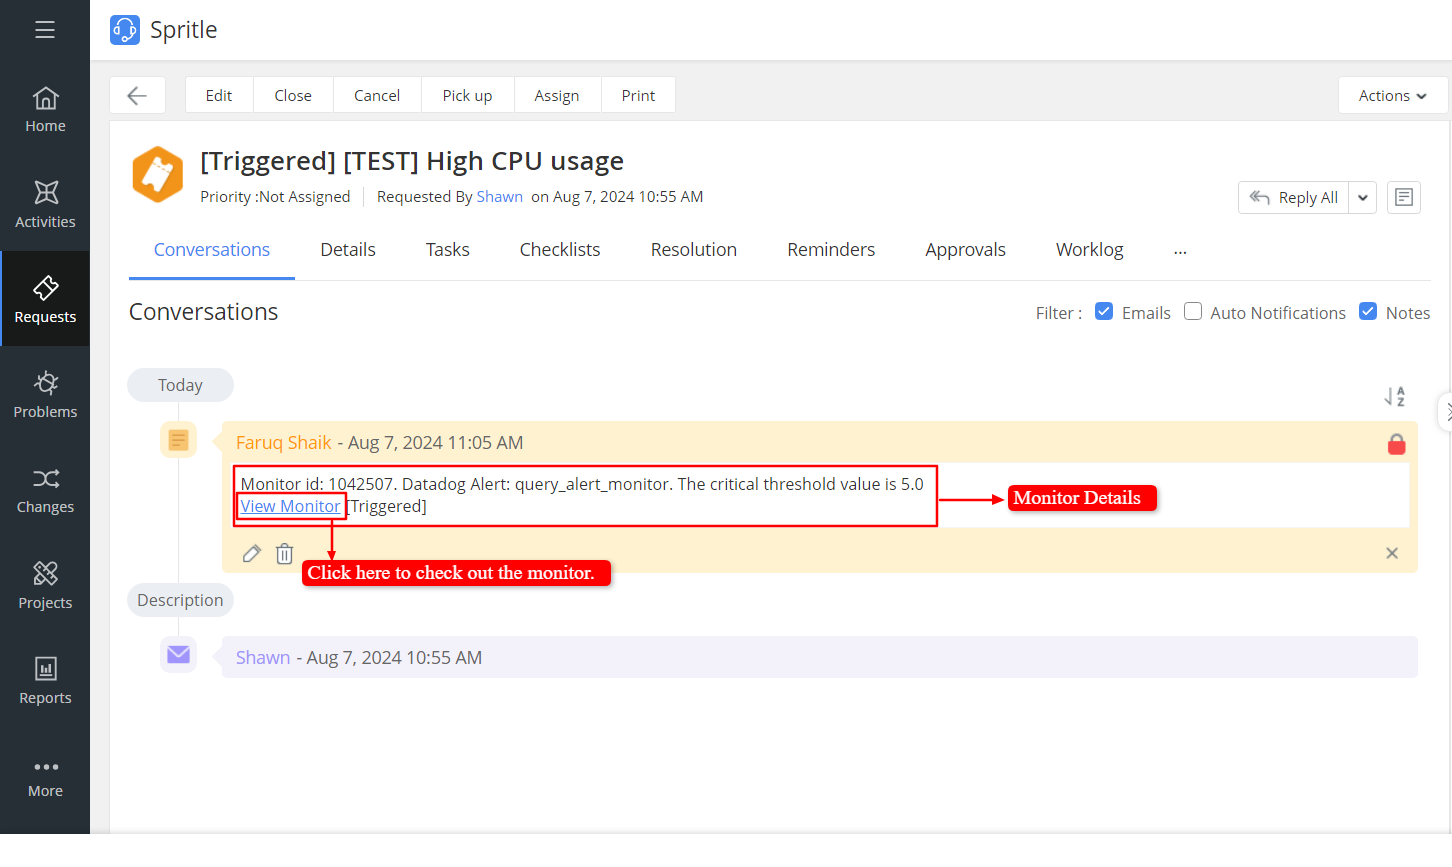
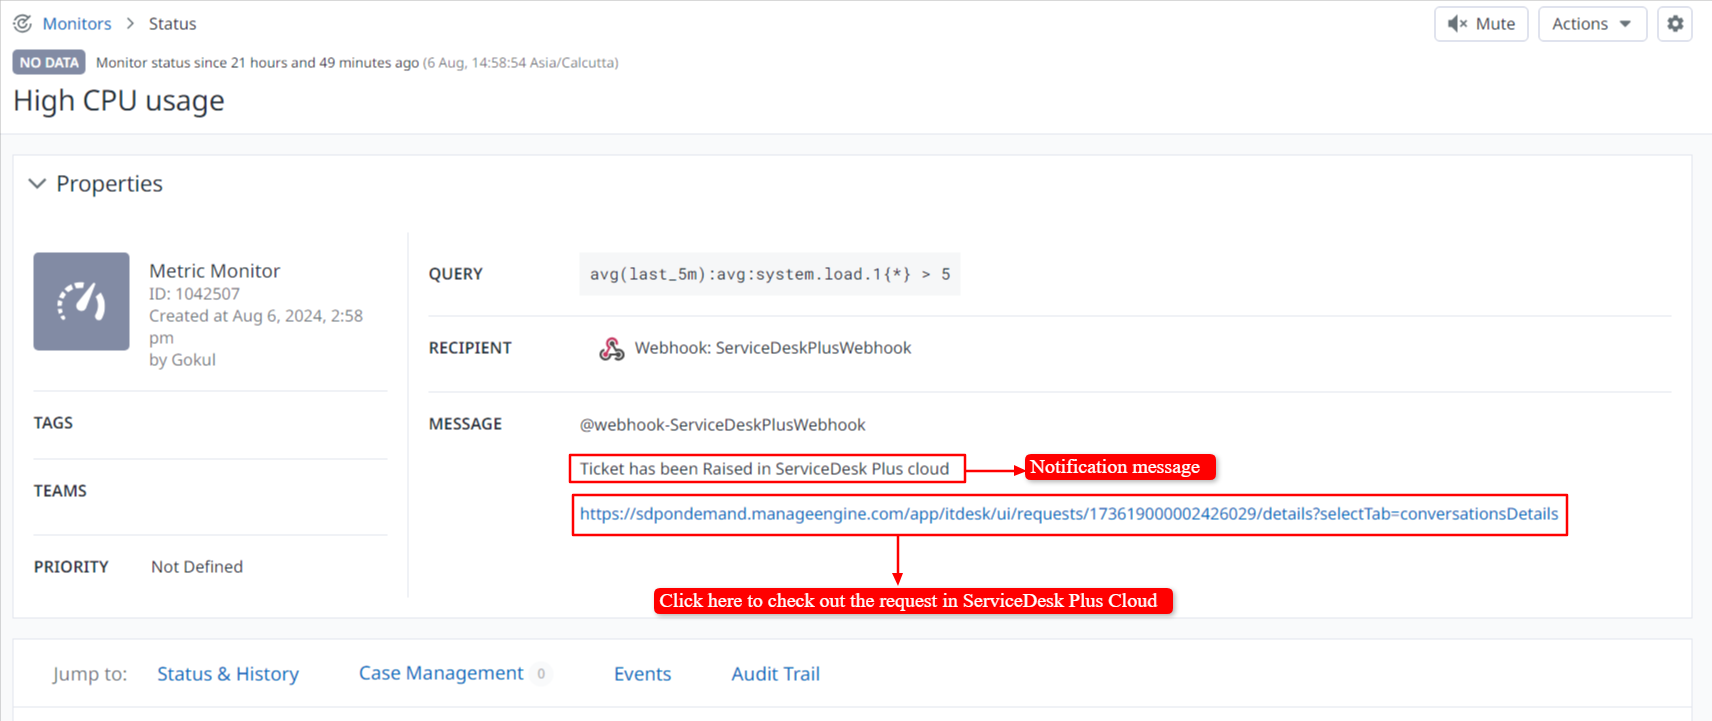
Note: Details such as monitor ID, alerts, and critical values are retrieved from DataDog monitors and displayed in the description. You can also click the view monitor to check the respective monitor.
When the Datadog monitor triggers an alert, a request is created with the status open. The request will be updated to resolved when the recovery alert triggers in the Datadog monitor.
Similarly, in the Datadog monitor status, you will see our webhook configured with messages indicating the ticket status in ServiceDesk Plus Cloud(SDP). When an alert is triggered, the message will read Ticket has been created in ServiceDesk Plus Cloud. If a recovery alert is triggered, the message will read Ticket has been resolved in ServiceDesk Plus Cloud. You can click the Link provided to check the respective request in ManageEngine ServiceDesk Plus Cloud (SDP).